Transport for London (TfL) massaged figures for the road safety benefits of its 20mph speed limit roll-out by comparing pre-pandemic and lockdown data,Transport Network can reveal.
The transport authority initially claimed a 25% fall in KSI collisions on key roads since 20mph speed limits were implemented.
However, under questioning from Transport Network it admitted the claim was based on comparisons between pre-pandemic data and data covering pandemic lockdowns, when traffic levels were significantly lower.
An internal TfL document shows that officials knew that a 24.9% fall in collisions resulting in someone being killed or seriously injured (KSI) should be seen against a ‘background’ reduction of around 16.5% due to less traffic.
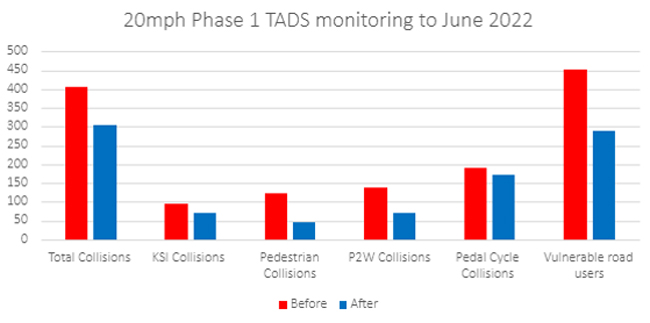
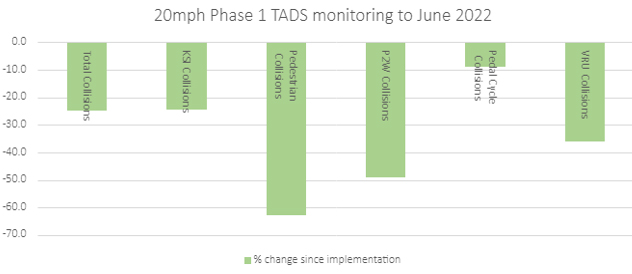
However, this was not mentioned in TfL’s press release, on Monday, which said monitoring of 20mph schemes showed that since they were introduced, the number of collisions had reduced from 406 to 304 (25%) with KSI collisions also falling by a quarter, from 94 to 71.
It added that collisions involving vulnerable road users decreased from 453 to 290 (36%) while collisions involving people walking fell from 124 to 46 (63%).
Source TfL
In the press statement, the transport authority did not state which roads the data covered or which periods the ‘before’ and ‘after’ statistics came from.
Penny Rees, TfL's head of healthy streets investment, even said 'it’s brilliant to see the huge impact the introduction of 20mph speed limits has had on road safety around London', with no mention of the pandemic's impact.
TfL has now clarified that the statistics showing lower collisions cover the roads within the central London Congestion Charging zone on which it introduced 20mph speed limits in March 2020, and covers the period from May 2020 to June 2022.
The foreword to TfL’s own Vision Zero action plan progress report, published in November 2021, states: ‘The coronavirus pandemic led to a significant fall in travel on our roads, and as a result, 2020 saw a huge reduction in road deaths and serious injuries.’
Jack Cousens, head of roads policy for the AA, said: 'Safety statistics are important and everyone needs to ensure that the data presented is transparent and accurately presented.
'Failing to properly explain how the pandemic impacted road safety statistics is disappointing, especially when it was obvious to everyone that traffic volumes had reduced considerably.'
In March 2021, the Office for National Statistics reported that the volume of motor vehicle traffic had recovered to 77% of the level seen on the first week in February 2020.
Over the next year, traffic returned to, and in some cases went above, levels seen before the pandemic but fell towards the end of 2021 before recovering again.
It is established good practice for road safety data to expressly note the impact of coronavirus restrictions on traffic levels and point out the likely impact and other TfL documents, both internal and external, have done this.
In fact, an internal TfL document about the 25% fall in KSIs on 20mph roads refers to a London-wide ‘background’ reduction of around 16.5%, ‘a comparison which enables the impact of the pandemic to be reflected’.
Source: TfL
Further adding to concerns that it may be cherry-picking data, TfL said that since the 20mph speed limits were introduced across London, there have been reductions of 1.7mph-5mph across ‘most sites surveyed’.
It also claimed that analysis of journey times, traffic flows and speeds ‘suggest’ that the 20mph speed limit has not increased congestion. It has not published the data on the basis of this claim but it appears that it was also a comparison between pre-pandemic traffic and traffic levels from a period significantly impacted by coronavirus restrictions.
Register now for full access
Register just once to get unrestricted, real-time coverage of the issues and challenges facing UK transport and highways engineers.
Full website content includes the latest news, exclusive commentary from leading industry figures and detailed topical analysis of the highways, transportation, environment and place-shaping sectors.
Use the link below to register your details for full, free access.
Already a registered? Login
