Local highways and transport services in England saw a second year of solid growth in capital expenditure, although councils’ debt levels are also on the rise.
Official figures from the Department for Communities and local Government (DCLG) reveal highways and transport capital spending increased by 12.4% to reach £7.4bn up from £6.6bn in 2013-14, which in turn increased from just over £6bn in 2012-13.
Total capital expenditure by local authorities in England increased to £21.5bn in 2014-15 from £19.7bn in 2013-14, a year-on-year increase of 9.5%.
Once again government forecasts were proven to be very wide of the mark, after predicting a total outlay of some 20% more at £27.1bn. Provisional figures released in June were also off target, suggesting highways and transport capital expenditure for 2014-15 would be somewhere near £8.2bn.
The services were also expected to bring in £48m in capital receipts but only delivered £38m.
Housing increased to £4.8bn from £4.0bn in 2013-14, a year-on-year increase of 21.3% and brought in £1.4bn.
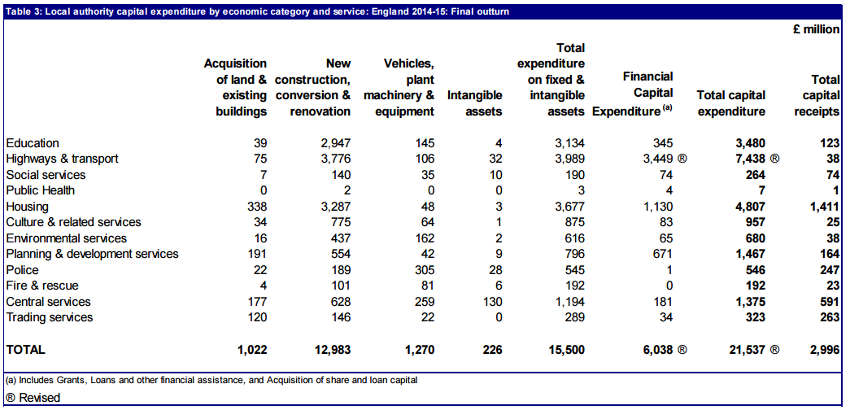
Table from DCLG
Planning and development services spent around £1.5bn and brought back in £164m in capital receipts. This is an increase in spending of around 30% from £1.1bn in 2013-14, although 18% of the total comes from GLA’s planned phased expenditure on the Olympic Park.
Environmental services spent £680m and brought £38m back in.
One issue arising from the figures is the increasing levels of debt councils have after seeing net debt rise by 14.2% over the last five financial years.
Local government sources have suggested this is a concern giving the increasing levels of inflation councils are faced with on major infrastructure projects, such as the Norwich Northern Distributor Road.
DCLG officials state: ‘At the beginning of 2014-15, local authority external debt stood at £97.6bn. At the end of 2014-15, local authority external debt stood at £100.4bn, an increase of 2.9%.’
Operational boundaries and authorised limits for local authority external debt also saw their margins narrow by 2% in 2014-15.
At the beginning of 2014-15, local authority external debt was below the operational boundaries and authorised limits by margins of £27.9bn and £44.9bn respectively, DCLG officials have revealed.
Local authorities do appear to be attempting to service expenditure in a more sustainable way however. The use of capital receipts to finance local authority capital expenditure saw the largest increase of any financing model as it jumped by 23.9% between 2013-14 and 2014-15, from £1.5bn to £1.9bn.
The financing of capital expenditure through central government grants increased to £8.5bn from £7.5bn - a year-on-year increase of 13.9% – equating to 39.6% of the total financing of capital expenditure in 2014-15.
Revenue financing of capital expenditure increased to £5.2bn up from £4.9bn in 2013-14, a year-on-year increase of 6.5%.
