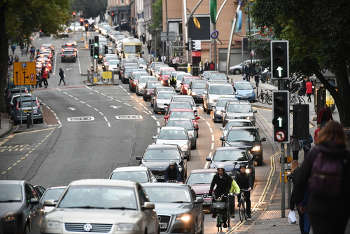
Four in five areas still have illegal levels of toxic air pollution, almost a decade after legal limits were introduced, campaigners have said.
This week, the UK Government published its latest figures on air pollution data as part of a legal requirement under the EU Ambient Air Quality directive, which came into force in 2010.
Under the directive, the annual average concentration level of nitrogen dioxide (NO2), which mainly comes from road traffic, must not exceed 40µg/m3 (micrograms per cubic metre of air).

Bristol's mayor has been criticised over his approach to toxic air
Campaign group ClientEarth said its analysis of the data reveals that only seven out of 43 (83%) of reporting zones have legal levels of pollution.
It said this ‘demonstrates how the UK government has made almost no progress in meeting legal obligations that should have been met in 2010’.
ClientEarth’s clean air campaigns and policy ,anager, Andrea Lee, said: ‘Almost ten years after legal limits should have been met, it is astounding that only seven out of 43 zones have legal levels of air pollution.
‘This is not simply a failure by the government to comply with its legal duties but, most importantly, it is a failure to protect the health of people across the country from toxic air.’
The Greater London Urban Area has the highest maximum modelled annual mean concentration at 89µg/m3, more than twice the legal limit.
ClientEarth, which has repeatedly taken ministers to court over the issue, pointed out that the Government’s approach was to direct local councils to reduce air a pollution to within the legal limit within the shortest possible time.
But it said this has mostly led to delays and weak proposals as local authorities lack the resources, capacity and leadership to get to grip with the problem.
Ms Lee added: ‘Local authorities clearly cannot deal with this matter on their own. We need leadership and action on a national scale. The government needs to sort this mess and act urgently to tackle this public health crisis.
‘This needs to start with new clean air laws in the upcoming Environment Bill.’
A spokesperson for environment deparment Defra said: 'We know the impact air pollution has on communities around the UK, which is why we are stepping up the pace and taking urgent action to improve air quality.
'This annual report shows we are making positive progress towards reducing air pollution.
'But we know there is still more to do. We are working hard to reduce transport emissions and are already investing £3.5 billion to clean up our air, while our Clean Air Strategy has been praised by the WHO as an ‘example for the rest of the world to follow’. Our forthcoming Environment Bill will give legal force to that Strategy and put environmental accountability at the heart of government.'
Zone name and maximum modelled annual mean concentration
- Greater London Urban Area 89μg/m3 – 2.2 times legal limit
- South Wales 62 – 1.6μg/m3 – 1.6 times legal limit
- West Midlands Urban Area 58μg/m3 – 1.5 times legal limit
- Glasgow Urban Area 61μg/m3 – 1.5 times legal limit
- Tyneside 54μg/m3 – 1.4 times legal limit
- Teesside Urban Area 55μg/m3 – 1.4 times legal limit
- Southampton Urban Area 55μg/m3 – 1.4 times legal limit
- Eastern 54μg/m3 – 1.4 times over legal limit
- West Midlands 54μg/m3 – 1.4 times legal limit
- North East 54μg/m3 – 1.4 times legal limit
- Greater Manchester Urban Area 50μg/m3 – 1.3 times legal limit
- West Yorkshire Urban Area 53μg/m3 – 1.3 times legal limit
- Sheffield Urban Area 53μg/m3 – 1.3 times legal limit
- Portsmouth Urban Area 50μg/m3 – 1.3 times legal limit
- The Potteries 53μg/m3 – 1.3 times legal limit
- Coventry/Bedworth 50μg/m3 – 1.3 times legal limit
- Edinburgh Urban Area 51μg/m3 – 1.3 times legal limit
- South East 51μg/m3 – 1.3 times legal limit
- North West Merseyside 50μg/m3 – 1.3 times legal limit
- Yorkshire Humberside 53μg/m3 – 1.3 times legal limit
- Central Scotland 51μg/m3 – 1.3 times legal limit
- Liverpool Urban Area 48μg/m3 – 1.2 times legal limit
- Nottingham Urban Area 46μg/m3 – 1.2 times legal limit
- Bristol Urban Area 47μg/m3 – 1.2 times legal limit
- Bournemouth Urban Area 46μg/m3 – 1.2 times legal limit
- Reading/Wokingham Urban Area 46μg/m3 – 1.2 times legal limit
- Southend Urban Area 48μg/m3 – 1.2 times legal limit
- Cardiff Urban Area 46μg/m3 – 1.2 times legal limit
- Belfast Urban Area 49μg/m3 – 1.2 times legal limit
- East Midlands 48μg/m3 – 1.2 times legal limit
- North Wales 49μg/m3 – 1.2 times legal limit
- Leicester Urban Area 43μg/m3 – 1.1 times legal limit
- Kingston upon Hull 45μg/m3 – 1.1 times legal limit
- Swansea Urban Area 42μg/m3 – 1.1 times legal limit
- South West 44μg/m3 – 1.1 times legal limit
- North East Scotland 44μg/m3 – 1.1 times legal limit
- Birkenhead Urban Area 40μg/m3 – 1 times legal limit
- Brighton/Worthing/Littlehampton 37μg/m3 – 0.9 times legal limit
- Northern Ireland 35μg/m3 – 0.9 times legal limit
- Blackpool Urban Area 30μg/m3 – 0.8 times legal limit
- Preston Urban Area 32μg/m3 – 0.8 times legal limit
- Scottish Borders 30μg/m3 – 0.8 times legal limit
- Highland 26μg/m3 – 0.7 times legal limit
Source: Client Earth
Register now for full access
Register just once to get unrestricted, real-time coverage of the issues and challenges facing UK transport and highways engineers.
Full website content includes the latest news, exclusive commentary from leading industry figures and detailed topical analysis of the highways, transportation, environment and place-shaping sectors.
Use the link below to register your details for full, free access.
Already a registered? Login