Following Transport for London's recent announcement of a £148m investment in boroughs' Local Implementation Plans (LIPs) for 2016/17, Jason Hawthorne, MD of Wagstaffs, looks at how 3D digital visualisation can help transport planning in busy urban environments.
It is positive news to hear Transport for London (TfL) has announced £148m of funding to improve roads, junctions and public spaces around the capital, however any changes to London’s complex infrastructure can often prove controversial.
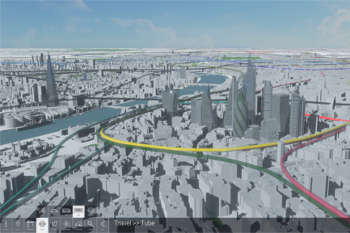
Image from VUCITY software
Visualising the scheme using 3D digital tools will mean the public, stakeholders and TfL can better understand how the proposed changes will affect journeys. And they can explore alternatives where schemes have several options.
But these days the power of digital visualisation enables us to do so much more. How will these changes impact on the surrounding areas? How will the scheme integrate with the rest of London?
Using 3D visualisation technologies can help the public, stakeholders and TfL to understand how proposed changes will fit into the bigger picture. In this instance there are a number of changes being proposed across the capital, including schemes in the City, Westminster, Kensington and Chelsea, Camden and Islington and Southwark.
The string of projects announced by TfL includes a redesign of Bank junction and a ‘mini-Holland’ scheme in Stratford , in a bid to improve the experience and flow of pedestrians and cyclists across the capital.
Other plans include work to bring down Islington’s high number of road accidents, removing the gyratory in Morden town centre and building a new waterside cycle route in Greenwich.
Digital visualisation technologies such as VUCITY mean we can overlay data, including traffic flows and predicted increases in traffic, to illustrate the impact of changes on the local and wider area.
We can also use digital visualisation to see how proposed changes will interact with forthcoming transport infrastructure projects.

Jason Hawthorne, MD, Wagstaffs
Data which could be overlaid might also include accidents involving cyclists and pedestrians to highlight incident hotspots. This would illustrate the need for action and show where the main problems were.
Digital visualisation tools can be used to switch changes to infrastructure on and off, so the two options can be compared, while overlaying data.
When we worked with the City of London to communicate the proposed reconfiguration of the Aldgate Gyratory system, we used 3D digital visualisation tools to illustrate the changes to the traffic layout.
The changes were designed to ensure traffic flow. The scheme introduced pedestrian crossing points to allow easier navigation of bus services and created two new public spaces on the eastern edge of the City of London.
The centrepiece of the scheme was a large public space uniting two listed buildings: Sir John Cass’s Foundation Primary School and the St Botolph without Aldgate Church.
Digital visualisation tools could be used to help people imagine proposed changes to public spaces in this TfL scheme too. While digital visualisation does not provide the solution to complex transport problems, it can help to inform the debate and help the public and transport chiefs to understand the issues better.
